Aggregators
Who Wins in Food Delivery at 9pm? UberEats, Glovo or JustEat

Hi, it’s Wassim from Burger Index
On this week’s BI Insights we analyse what customers actually see when choosing between Glovo, Just Eat and Uber Eats at 21:00 across 84 locations in Madrid.
What customers see varies significantly by platform and that difference drives what gets ordered.
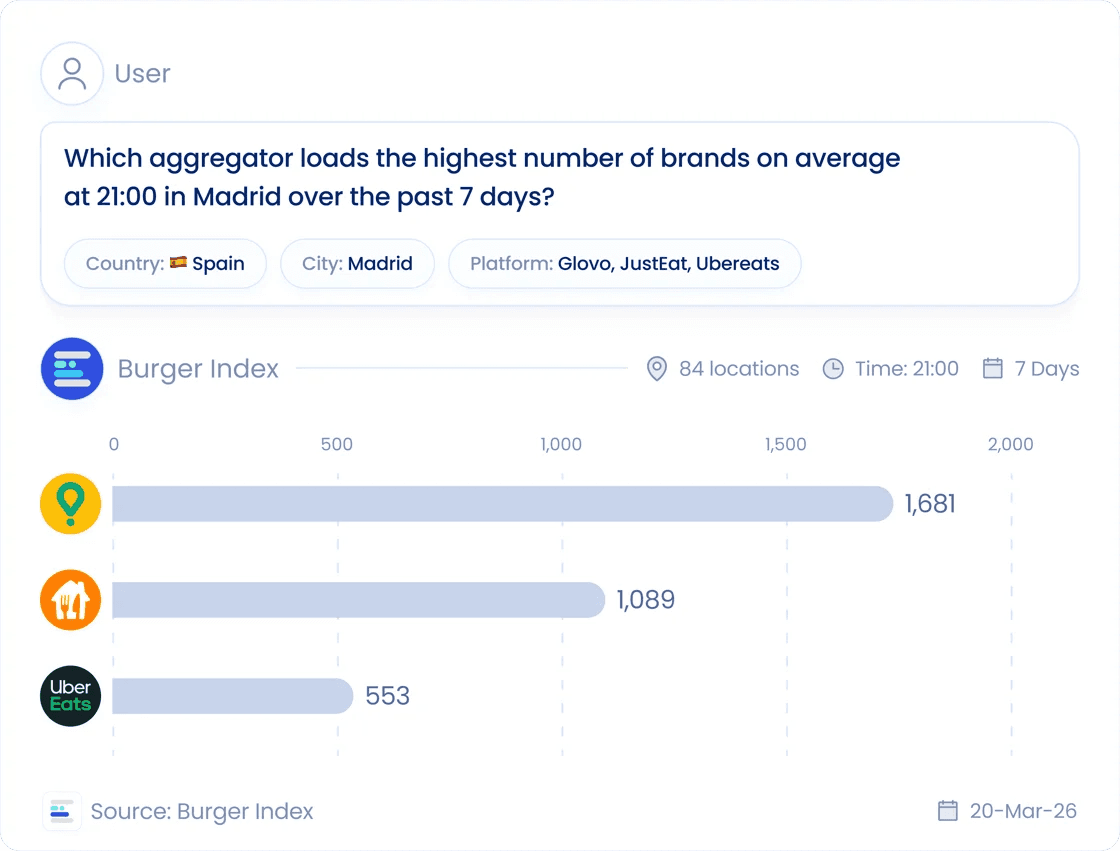
1. Visibility beats everything
Glovo dominates what customers see.
3x more brands than Uber Eats across Madrid
~3.5x more brands from a single central pin
More brands = higher probability of conversion.
If you’re not visible, price and speed don’t matter.
2. Reach ≠ advantage
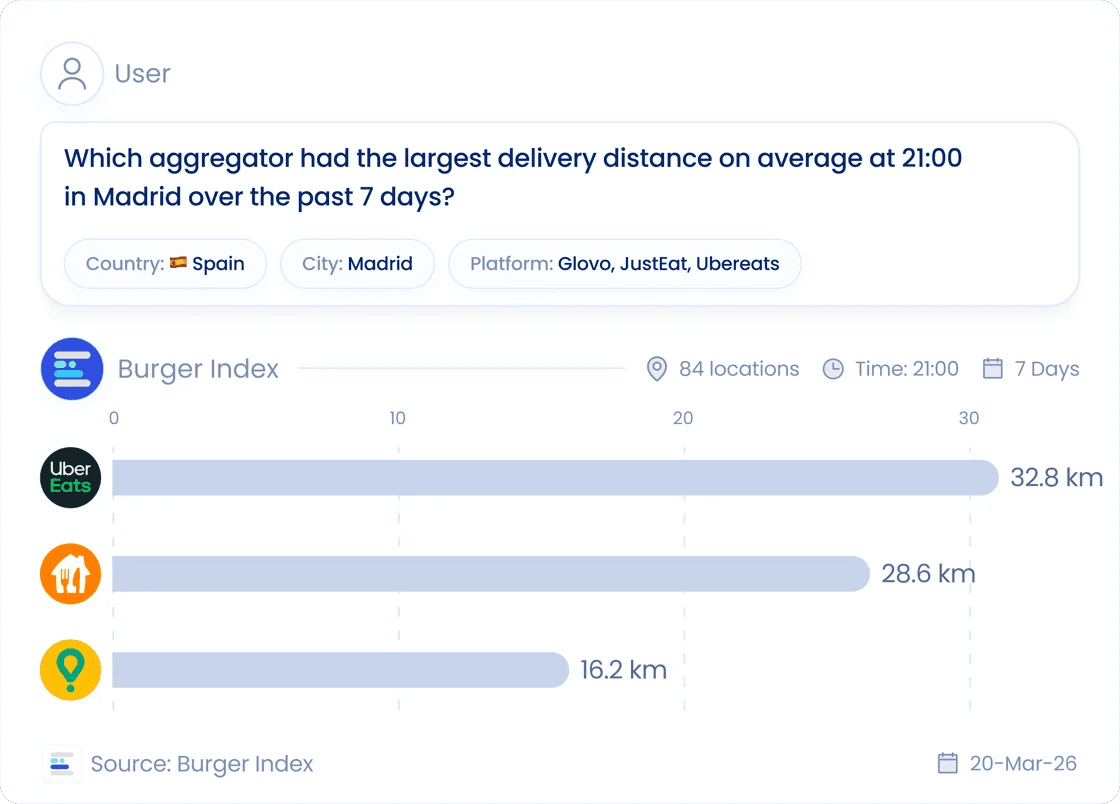
Uber Eats delivers furthest (32.8 km vs 16.2 km for Glovo).
But most orders happen within 5 km.
Inside that core radius:
Glovo leads in brand density at every distance
Uber Eats only catches up beyond 5 km
Translation: Uber Eats wins the long tail. Glovo wins the demand zone.
3. The market is hyperlocal
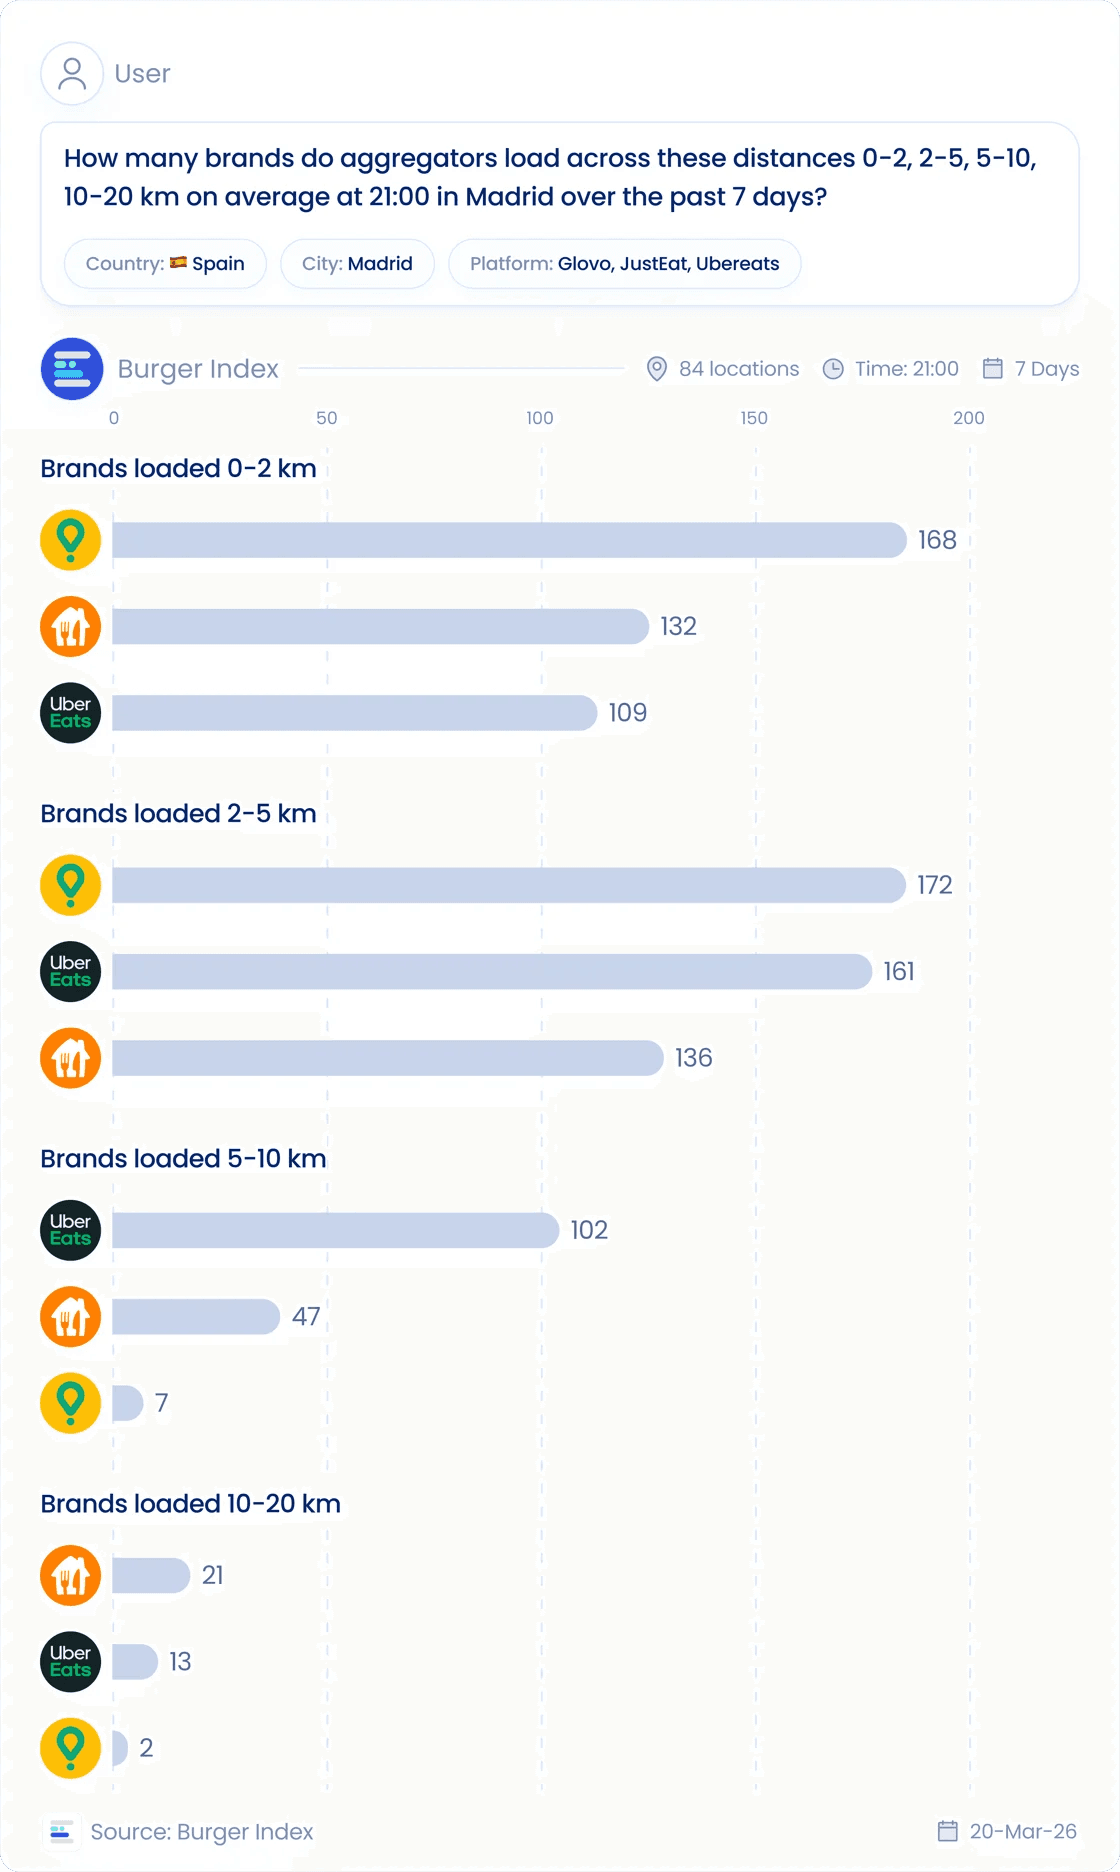
Across Madrid at 21:00 competition is concentrated within 5 km and this is where Glovo leads as it consistently loads more brands, giving it higher visibility where most orders originate.
0–2 km: Glovo leads (168), followed by Just Eat (132) and Uber Eats (109)
2–5 km: Glovo remains highest (172), ahead of Uber Eats (161) and Just Eat (136)
Beyond 5 km, the dynamic reverses:
5–10 km: Uber Eats leads (102), vs Just Eat (47) and Glovo (7)
10–20 km: Just Eat leads (21), Uber Eats (13), Glovo (2)
Glovo operates a dense, short-range network. Uber Eats extends further but with thinner supply. The result: reach expands coverage, but density drives conversion.
4. Price and speed are not the bottleneck
Uber Eats is:
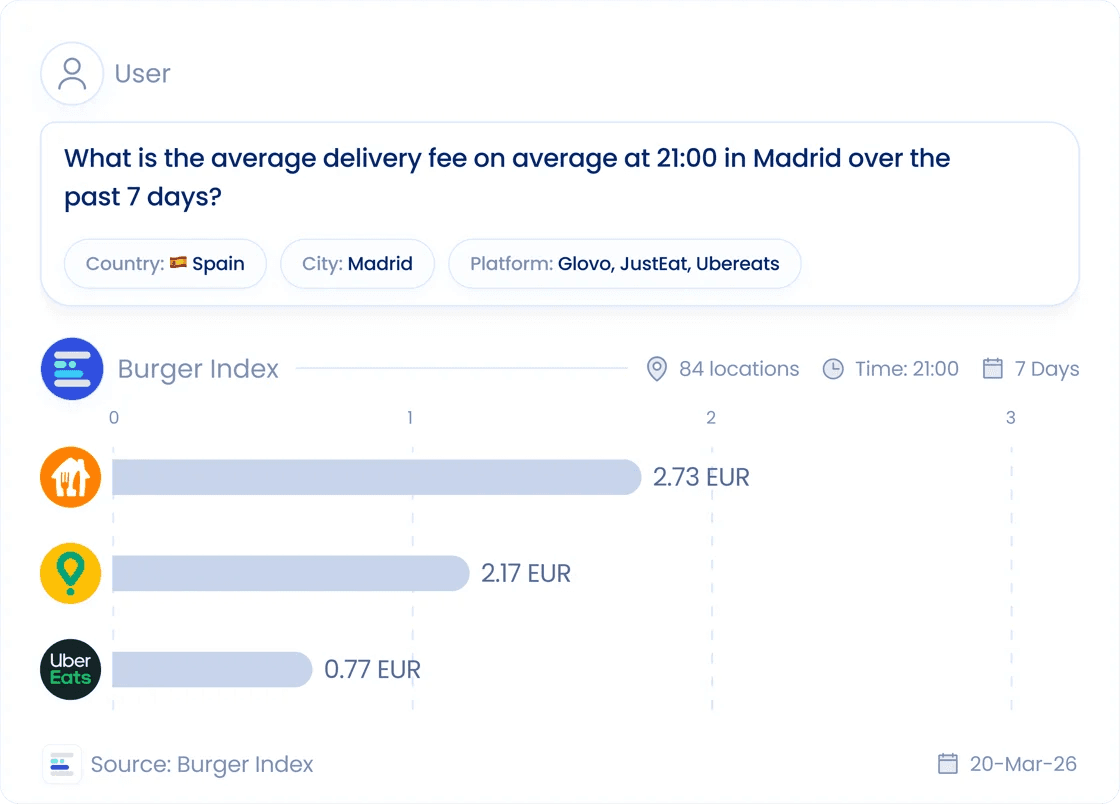
Cheapest (€0.77 avg, €0 in central Madrid)
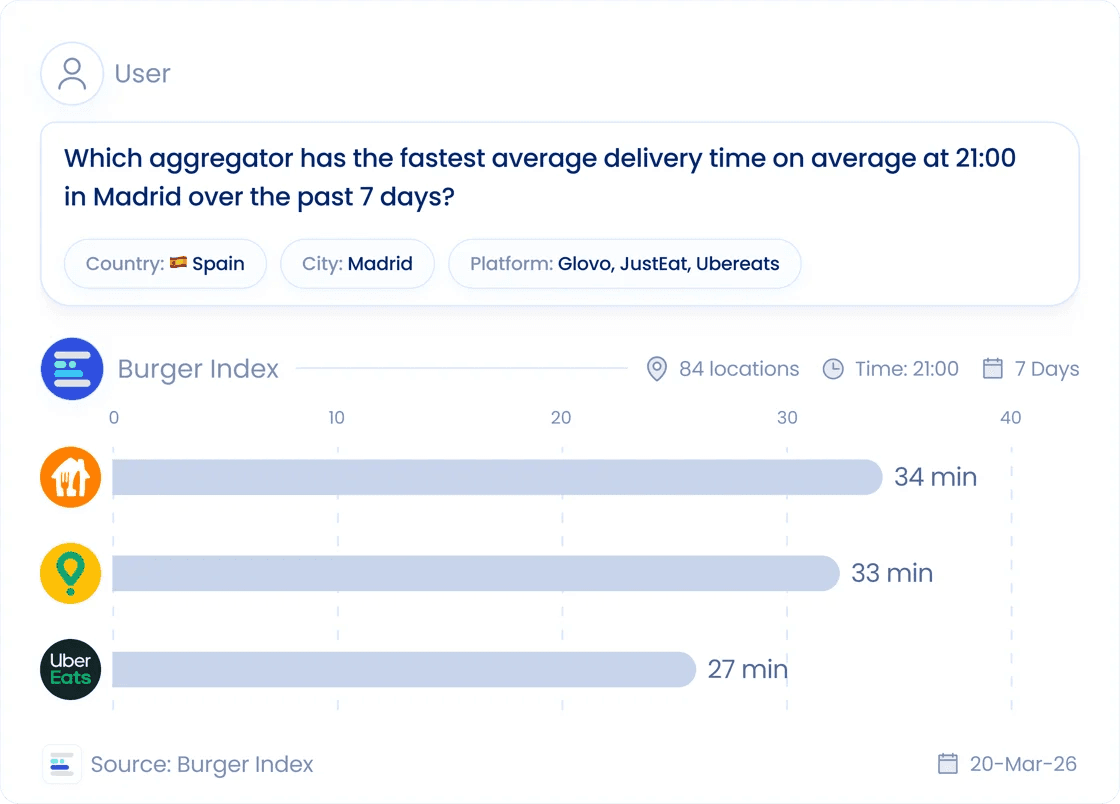
Fastest (27 min avg, 21 min in central Madrid)
Yet it still shows fewer brands.
Why this matters for aggregators
More brands = more orders
Competitors win on supply, not just price or speed
Radius expansion doesn’t fix low-density zones
Growth comes from fixing supply gaps.
If you can’t see this at a pin level, you can’t fix it.
Burger Index tracks brand availability, delivery fees, ETAs, and range daily at pin level, across platforms.
Run this analysis for any city, any platform, in any language.
👉 Reply “Madrid” to get the full dataset
👉 Or book a demo at burgerindex.com
The Burger Index Team
You might also like
Learn actionable strategies, proven workflows, and tips from experts to help your product thrive.