Grocery
How Carrefour vs AmazonNow Looks With (and Without) Taxonomy

Hi, it's Wassim from Burger Index
On this week’s BI Insights, we solve the “Why are our product match rates so low?” problem in eGrocery.
If you’ve ever compared product data between two major grocery platforms like Carrefour vs Amazon Now, you’ve probably heard this:
“Only 30–40% of our products are matching? That can't be right, everyone stocks the same stuff.”
It’s the most common reaction from eGrocery, CPG, and analytics teams. And honestly, we got tired of hearing it too, because until now, there was no fast way to prove or fix it.
So we built Taxonomy. Think of it as a unifying system that says:
“This is Greek yoghurt” (even if it's called ‘Greek Yogurt 170g 2+1’ elsewhere)
“This is Nutella” (even if it's ‘Chocolate Spread 200g Jar’ on another platform)
Let’s walk through what this actually looks like.
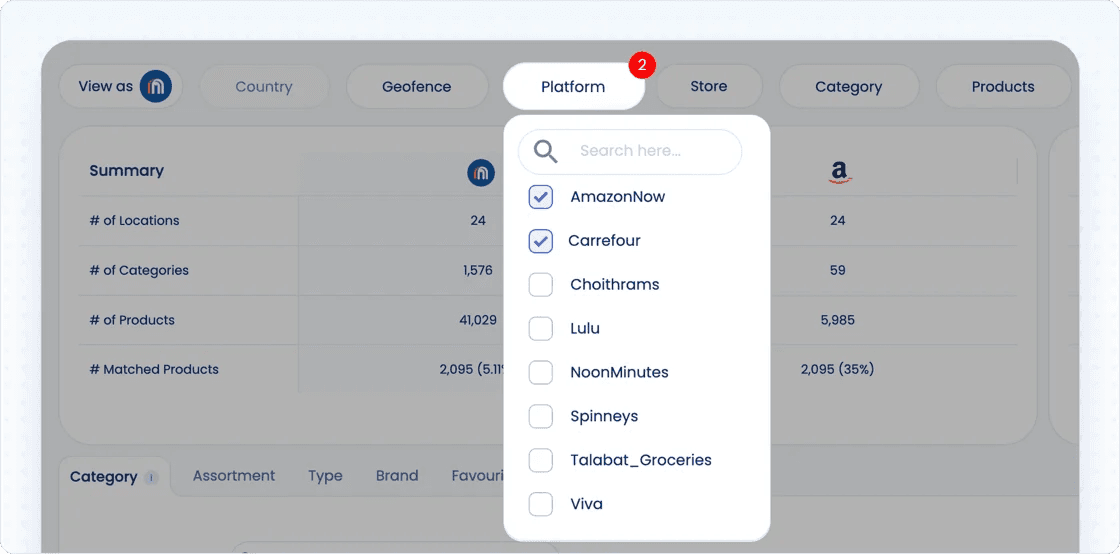
🛒 Step 1: Select Platforms to Compare
The first step in any product matching is selecting the platforms you want to benchmark. In this case, we’re comparing Carrefour and Amazon Now in UAE.
🧮 Step 2: Exact Product Matching, Without Taxonomy
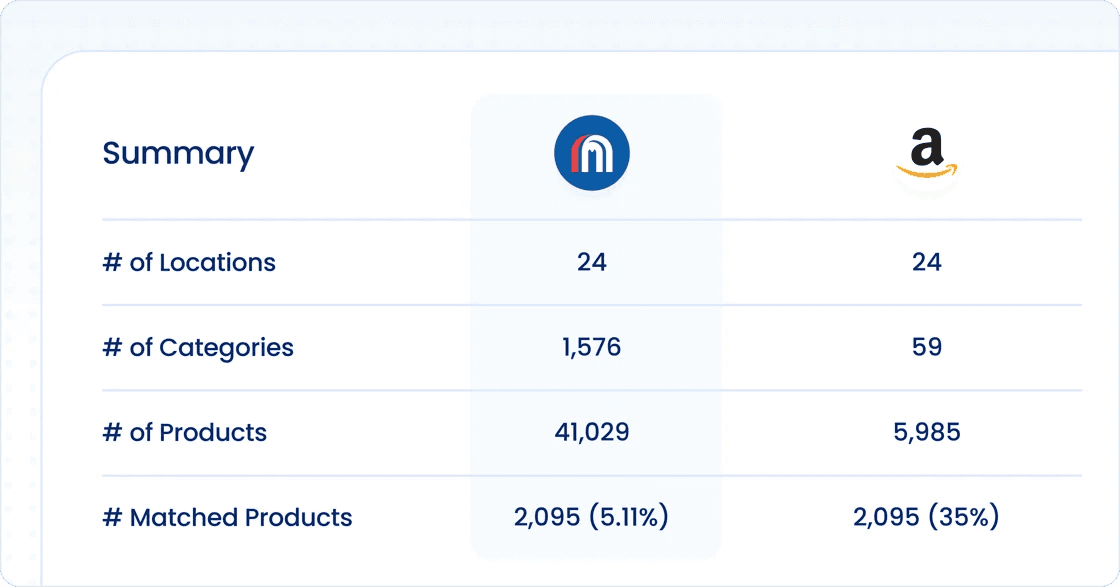
Before taxonomy:
Amazon: 2,095 of 5,985 products matched (35%) to Carrefour
Carrefour: 2,095 of 41,029 matched (5.11%) to Amazon Now
Seems broken, right? Not really. You're just comparing products that are exactly the same.
🗂️ Step 3: View Matched Products Grouped by Your Platform’s Categories
In the example below, I’m Carrefour, visualising matched products grouped under my categories comparing average price and total basket value against Amazon Now.
Across categories like Baby Products, Health & Fitness and Fruits & Vegetables, Amazon is on average 7.6% cheaper

📚 Step 4: Taxonomy Applied = Real Product Families
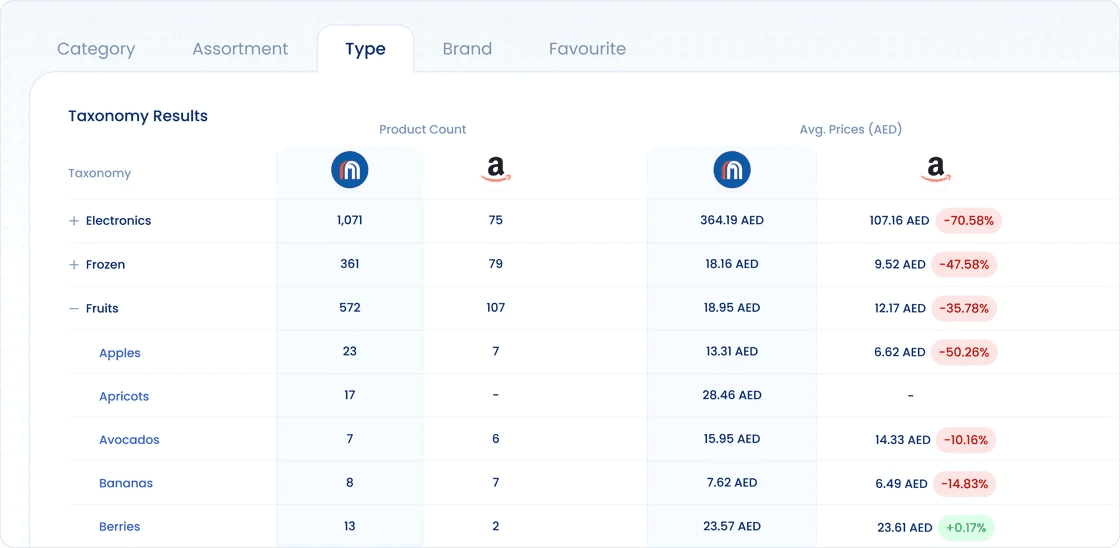
Now instead of classifying only matched products, we classify ALL products into standard buckets: Apples, Apricots, Avocados, Bananas, Berries and Grapes organised by type, name, brand, size and amount.
Avg. pricing variance becomes comparable.
Apples: Carrefour 13.31 vs 6.62 AED on Amazon Now (-50.26%)
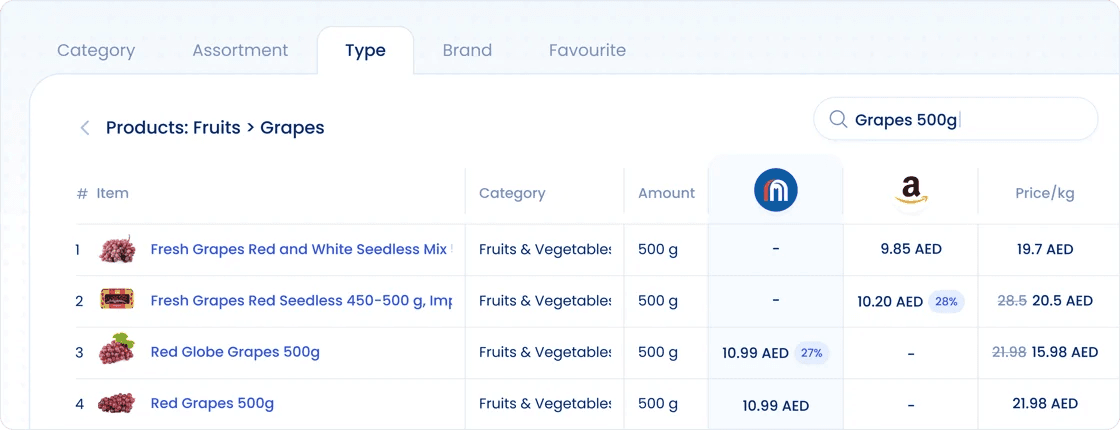
🍇 Step 5: Similar Product Matching Eg. Grapes 500g
Taxonomy groups 2 Carrefour products and 2 Amazon products as “Grapes 500g”.
Price/kg: ranges from 15.98 AED to 21.98 AED and you can now normalise price per unit to flag outliers.
This is what clean comparison actually looks like. You can even spot assortment duplication.
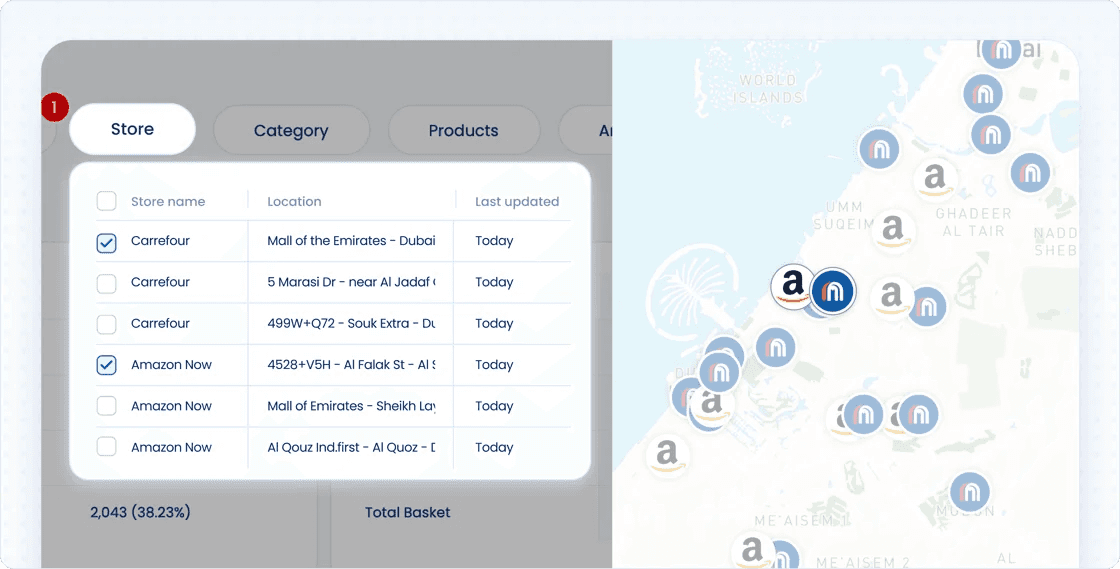
📍 Step 6: Store-Level Taxonomy
Finally, we can apply taxonomy at the store and area level.
💡 Why This Matters
Without taxonomy, you're making decisions with half the picture.
With taxonomy, you’re in control of:
✅ Price gaps
✅ Category coverage
✅ Product gaps
✅ Brand share benchmarking
✅ Assortment duplication
🧭 Next Steps
Want to run taxonomy across your own and competitor datasets?
→ Book a demo at burgerindex.com
The Burger Index Team
You might also like
Learn actionable strategies, proven workflows, and tips from experts to help your product thrive.